In my last post I explored how the construction of dams along the Cedar River led to Rattlesnake Lake swallowing the small town of Moncton in 1914. The dam-related disasters didn’t stop there, and the next one would be much worse.
After the flooding of Moncton, the engineers working for the City of Seattle attempted to address the seepage problem. They tunneled through the base of the Masonry Dam to drain the Masonry Pool, and then lined Masonry Pool with fine-grained sediment to try to plug the leaks. This took place between 1914 and 1918. Next, they cut a notch for a spillway at 72 feet above the base of the dam – elevation 1561. In December 1918 they blocked the tunnel and allowed the water level to rise to the spillway to test the sealing operations. This was a “conservative test” for the ultimate planned water height of 90 feet. The results were… not great. Seepage from behind the dam was measured at 500 cubic feet per second – greater than the annual yearly discharge rate of the Cedar River before the construction of the dam! This was measured by subtracting the amount of water released from behind the original crib dam with the amount of water flowing through the powerhouse below Cedar Falls.
This seepage took the form of a multitude of small springs forming at the base of the embankment, including at the head of Boxley Creek. This should have given somebody flashbacks to 1914. Unfortunately, no one took the hint. The engineers allowed the water level to “remain” at the higher elevation, aided by plentiful rain replacing what leaked out.
In 1914 the water rose relatively slowly as it drowned Moncton because the water level behind the Masonry Dam was raised in the spring after the worst of the wet season had finished. Apparently, no one had taken the time to seriously consider what would happen if a Moncton-style seepage event coincided with one of the PNW’s notoriously damp winter days.
This second story takes place in the little town of Edgewick, about 2 miles northeast of Rattlesnake Lake. Edgewick was a company town of about 60 inhabitants supporting the North Bend Lumber Company mill. You can see in the top of the map below.
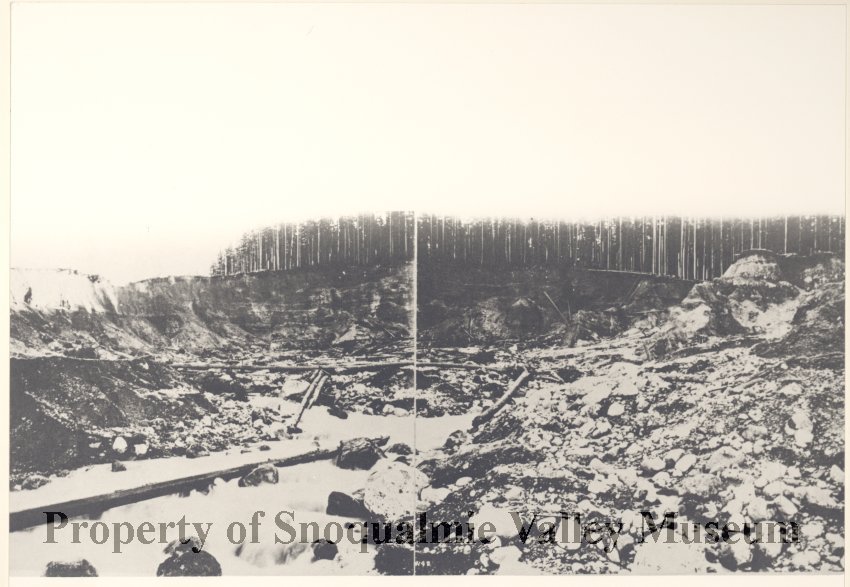
December 23, 1918 was a tremendously wet day in the Cascades. Creeks were swelling past their banks. Charles Moore, the night watchman for the lumber mill, was bored enough to watch Boxley Creek rise bit by bit. Around midnight, it started rising by a foot or more every few minutes! He ran, banging on the doors of few dozen buildings in Edgewick, urging everyone to run to higher ground as the water rose ankle deep in the main street. They heard a massive crunching noise and then a long rumble as a wall of mud swept around the corner to flatten the lumber mill and its town. All residents survived the flood but lost their possessions. A Milwaukee company train had passed by only a few minutes before the mudslide obliterated the tracks, narrowly avoiding disaster. The true scope of the damage was obvious when the sun rose. Even heavy machinery from the mill had been washing a quarter mile downstream by the force of the flood. Check out the photo of the ruined town below:
The “crunching noise” heard by the residents was the sound of 800,000 cubic yards of soil becoming unmoored from the moraine and slumping downhill. That’s equivalent to 53,333 elephants, or enough dirt to fill 242 Olympic swimming pools. The scar left by the huge slope failure can still be seen from the Rattlesnake Ledge trail across the valley – I’ve annotated it in the image below.

After 2 hours, 2 million cubic yards of soil were displaced – 606 Olympic swimming pools worth of sediment. Water had surged out of the moraine at a rate of at least 3,000 cubic feet per second – 6 times greater than the usual flow of the entire Cedar River. By 9 AM the following morning the flow rate was only a few feet per second. Throughout this whole cataclysm the water level in the main reservoir hadn’t changed at all. The huge quantity of water had been released from storage in the moraine itself, not the Masonry Pool or Chester Morse Lake.
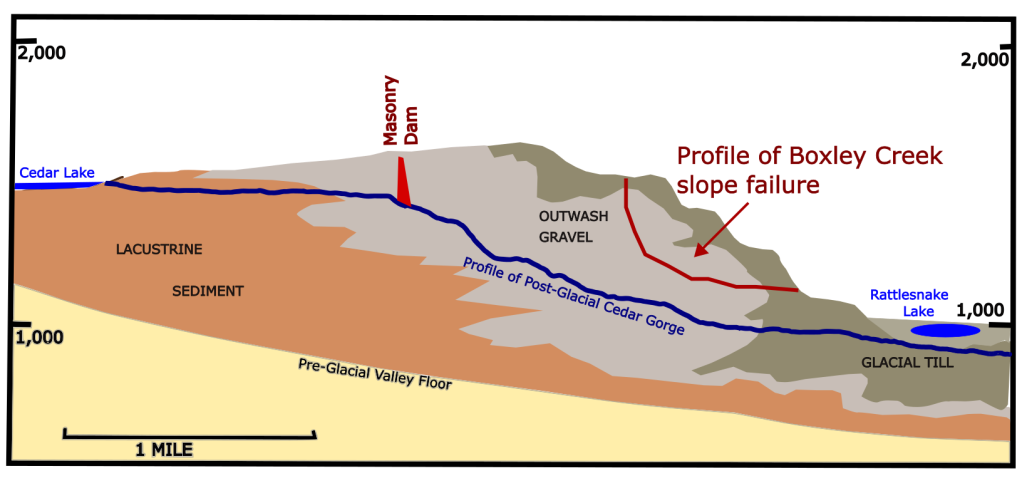
How could a slope like this blow out so spectacularly and suddenly? It’s time to start geologizing. The most important piece of the geologic puzzle lies in the multiple types of sediment that make up the moraine and how groundwater interacts with each one differently. A profile of the culprits is shown below.

The Boxley Creek slope failure that December night ripped through two types of glacial sediment – outwash gravel and glacial till. On the figure above, outwash gravel is shown in gray in the center of the moraine and glacial till is shown as a khaki layer on the exterior of the moraine.
The outwash gravel consists of gravel and coarse sand. It was deposited by streams flowing off of and around the edge of the massive Puget Sound ice sheet that I discussed in the previous post. These streams eroded through the jumbled sediment that the glacier scraped up the valleys as it advanced. Since this sediment is carried in water, the water sorted it depending on the speed of the stream. Fast-moving water carries a lot of energy and can move gravel and coarse sands. Slow-moving water carries too little energy to move larger sediment, and instead will carry fine sands and silts. Here, the streams sorted the sediment in a way that left behind exclusively coarse sand and gravel behind.
Glacial till is a whole different creature. It’s deposited by the glacial ice directly, not by streams, and so never gets sorted. This leaves behind a mix of sediment sizes: everything from boulders to fine sand, as well as a large proportion of fine sticky clay created as the glacier ground sediment beneath it like a huge millstone grinding grain into flour. This glacial till was deposited bit by bit on the glacier side of the moraine as the glacier retreated and stranded the till above the level of the streams.
The differences in grain sizes between outwash gravel and glacial till lead to fundamental differences in the properties that hydrologists use to describe how groundwater can flow through materials. The most important one for this case is called hydraulic conductivity, often abbreviated to K. Hydraulic conductivity describes how fast groundwater can flow through a given material. One of the common units for K is gallons per day per square foot of material – imagine keeping track of how many gallons of water could flow through a very small doorway full of dirt in a day. K is influenced by more familiar properties of the material, such as porosity (the amount of void space in the material) and permeability (the connectedness of those pores).
Poorly sorted materials, such glacial till, are much less porous or permeable because gaps between larger particles are plugged by tiny particles of clay. Glacial till therefore has a low value of K. Well-sorted coarse materials like the outwash gravels have high values for permeability and have high values of K. Water flows easily and quickly through the gravel in the interior of the moraine that borders Masonry Pool, and slowly through the glacial till. These concepts are illustrated in the image below.
Water flowing from the Masonry Pool through the moraine therefore has to pass through both kinds of material on its way northwest to become a seep that drowns Moncton or a spring near Boxley Creek. First it flows quickly and relatively easily through the outwash gravels (high value of K). Then it encounters a “bottleneck” of the lower permeability glacial till. Ranges of K in orders of magnitude are shown below in the chart I adapted from the famous Freeze & Cherry groundwater textbook, chapter 2:
You can see that in gravel, groundwater can travel at a rate of 10,000 to 1,000,000 gallons per day per square foot. In glacial till, groundwater travels at only 0.00001 to 1 gallon per day per square foot. If water is flowing into the moraine and through the gravel at a rate not exceeding 1 gallon per day per square foot, the water will peacefully flow through the glacially moraine – like it did in the case of Moncton’s slow demise.
However, if water flows through the gravel at a rate exceeding 1 gallon per day per square foot, pressure will build up on the upstream side of the glacial till. The till becomes that bottleneck. Imagine a sold-out crowd leaving a stadium – for example Taylor Swift fans leaving Seattle’s Lumen Field after the magnificent Eras tour last month. The stadium has lots of gates and wide concourses – it’s porous and permeable like the gravel. However, imagine those fans all trying to board the light rail – the International District station has only two entrances, and only a few hundred Swifties will fit on each train. It less permeable and porous, like the glacial till. Pressure would build up as the crowds can’t fit into the rail station and back up onto the street.
In the case of the Boxley blowout in 1918, the extremely wet weather and elevated water level in the Masonry Pool created a huge amount of water pressure in the moraine. This pressure could move quickly through the outwash gravels due to the gravels’ large value of K. However, the low K value of the glacial till stopped the groundwater in its tracks. Water pressure built up in the gravel to such an extent that it threatened to exceed the cohesive strength of the glacial till. The water table rose vertically because the water could not escape horizontally. Finally, at midnight on Christmas Eve 1918, the water pressure exceeded the critical value and literally blew through the glacial till, taking the whole slope with it in a huge mudslide.
The ensuing legal battle between the North Bend Lumber Company and the City of Seattle lasted until 1927. Dueling hired expert engineers and geologist debated whether the dam really caused the disaster, or if it was an act of God. Eventually, the judge decreed that Settle had to pay $336,945.80 in damages. The engineering team did learn a lesson though – ever since that day in 1918, daily records have been kept of water levels behind the dams and flows from nearby springs. The water level behind the Masonry Dam would never again be raised above the “temporary” spillway at 72 feet above the base of the dam, and even then only to the spillway in times of heavy rain. The dam was permanently abandoned as a potential source of hydropower. North Bend Lumber abandoned its mill in Edgewick, but a few residents decided to rebuild and stay. Tragically many of them were wiped out by another flood in 1932, this time from Boetzke Creek. That flood was caused by a railroad culvert blocked by debris amid extremely heavy rains.
My next post will have a much happier theme – my sister and I went on a Twin Trek to Jade Lake in July 2023! I met some expected granodiorite and some unexpected bright orange rock full of calcite crystals. Plus, why is Jade Lake so stupendously blue? Stay tuned!
References:
- This post relies heavily on “A Geologic Interpretation of the Failure of the Cedar Reservoir, Washington” by J. Hoover Mackin, published in 1941. Seattle residents can read it at the U of W library or otherwise you can order it for about $30. It’s an exhaustive booklet about the glacial geology of the region as well as the Moncton and Edgewick disasters. It contains so may more details that I did not add to this post about the relationships between water levels in various reservoirs, stream and spring discharge, and more.
- Article on the Boxley Blowout: https://www.historylink.org/File/2426#:~:text=On%20December%2023%2C%201918%2C%20heavy%20rain%20causes%20a,with%20gravel%20and%20detritus%2C%20down%20small%20Boxley%20Creek.
- Article on the 1932 flood of the remaining residents of Edgewick: https://www.historylink.org/File/10704
- Photo of the 1918 flood damage to the town: https://snoqualmievalleymuseum.pastperfectonline.com/photo/DDA774D5-FA23-44F7-B62C-007784617475
- Photo of the slope failure from 1918: https://snoqualmievalleymuseum.pastperfectonline.com/Photo/B8A387B2-3C0B-4E95-B618-024332391916


